Lithionics Battery® Value Proposition
When comparing Lithionics Battery® prices with legacy AGM Lead Acid batteries customers are often concerned with initial investment cost* of our LiFePO4 lithium batteries.
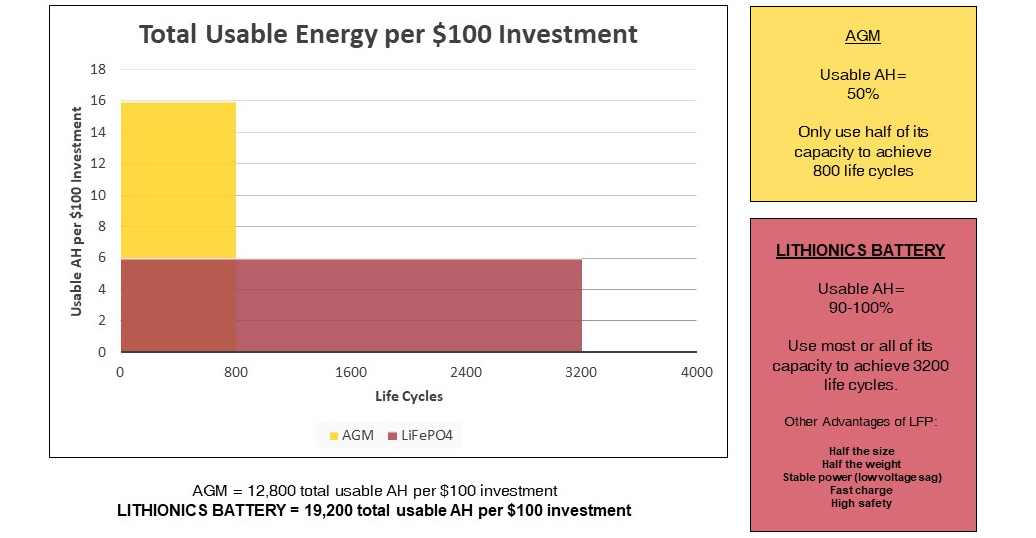
However, it is more appropriate to look at battery pricing and “total cost of ownership” by comparing Total Usable Energy over the life cycle of each battery. It is well known that AGM batteries should be used only to 50% of their rated capacity in order to get approximately 500 to 800 cycles before the battery must be replaced. On the other hand, Lithionics Battery® systems can be used to 100% of its rated capacity to get over 2000 cycles, but if used to 90% depth of charge via the Lithionics NeverDie® Reserve feature, then cycle life increases significantly**. We offer new settings for charging that increases cycle life well into the 1000’s of cycles. That could be over 10 years of daily use! Even at the end of that long period the battery still has up to 80% of remaining capacity and can be used even longer at shorter cycles.
To help visualize and compare Total Usable Energy we created an area chart showing total usable Amp-Hours per $100 investment. The yellow-shaded area is taller because an AGM battery has a lower price, so you get more AH’s or “though-put” per $100 investment. However, the area shaded red is much longer, because Lithionics Battery® offers at least 4 times more usable cycles. Surface area for each color represents total usable AH’s per $100 investment over the life cycle of the battery and clearly shows that Lithionics Battery® gives a better return on investment, despite higher initial investment.
Notes:
*Lithionics Battery® offers a 3 year leasing program to move the investment from a CAP-EX (capital expenditure) category to an OP-EX (operating expenditure) category
**Request a Life Expectancy Chart that shows the dramatic increase in cycle life available via different charger settings.